Wave Guides
Periodic architectures such as periodic truss lattices serve as excellent wave guides, since mechanical signals can propagate not arbitrarily in all directions but can only follow the discrete paths given by the truss network. This leads to interesting directional behavior: when the truss is tailored appropriately, energy flows not radially from the point of excitation but, at specific frequencies, energy and signals spread only in specific preferred directions (which we refer to as wave guiding). We investigate how such wave guidance occurs physically, we provide numerical tools for their characterization, and we aim for novel metamaterial designs (including spatially graded instead of periodic architectures) with enhanced wave control opportunities.
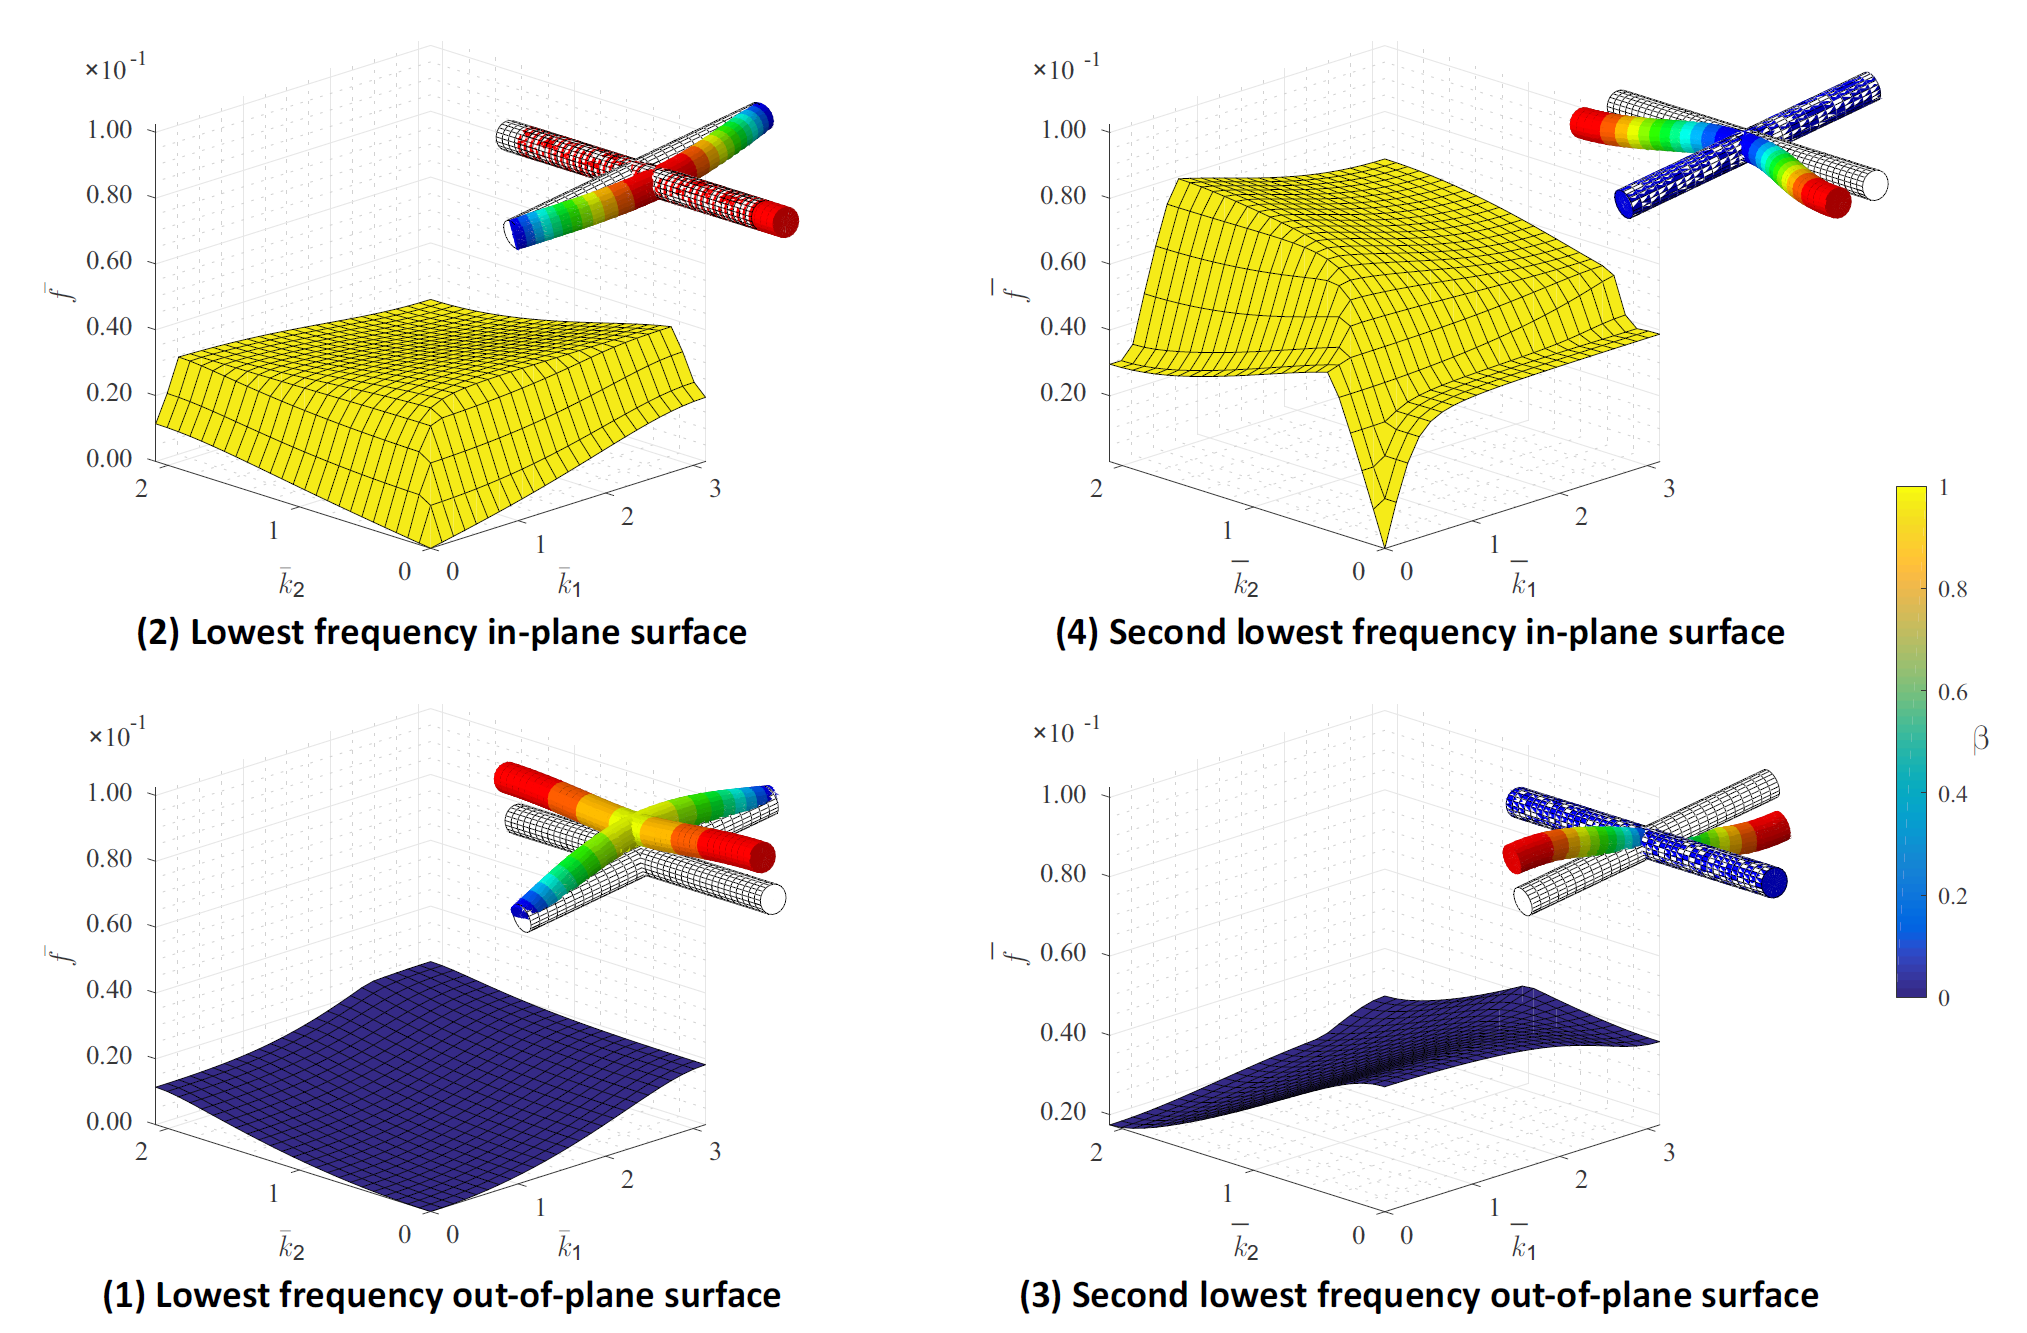
As an example consider a 2D square lattice, composed of trusses of equal lengths arranged in a square-type fashion. When excited mechanically, the truss propagates stress waves. To do so, it engages its vibrational modes which can be classified into in-plane and out-of-plane modes, depending on the primary mode of deformation. As an example, the lowest four eigenfrequencies and their corresponding mode shapes for the square truss are shown below. Also shown are the corresponding dispersion surfaces (i.e., the surfaces which provide the mapping between a wave vector k in reciprocal space and the corresponding eigenfrequency).
From the dispersion surfaces we calculate the group velocity (which is defined as (the magnitude of) the normal vector on the dispersion surface). Considering the lowest few dispersion surfaces and computing the group velocity for each of those results in a complete understanding of how energy flows through the lattice upon mechanical excitation.
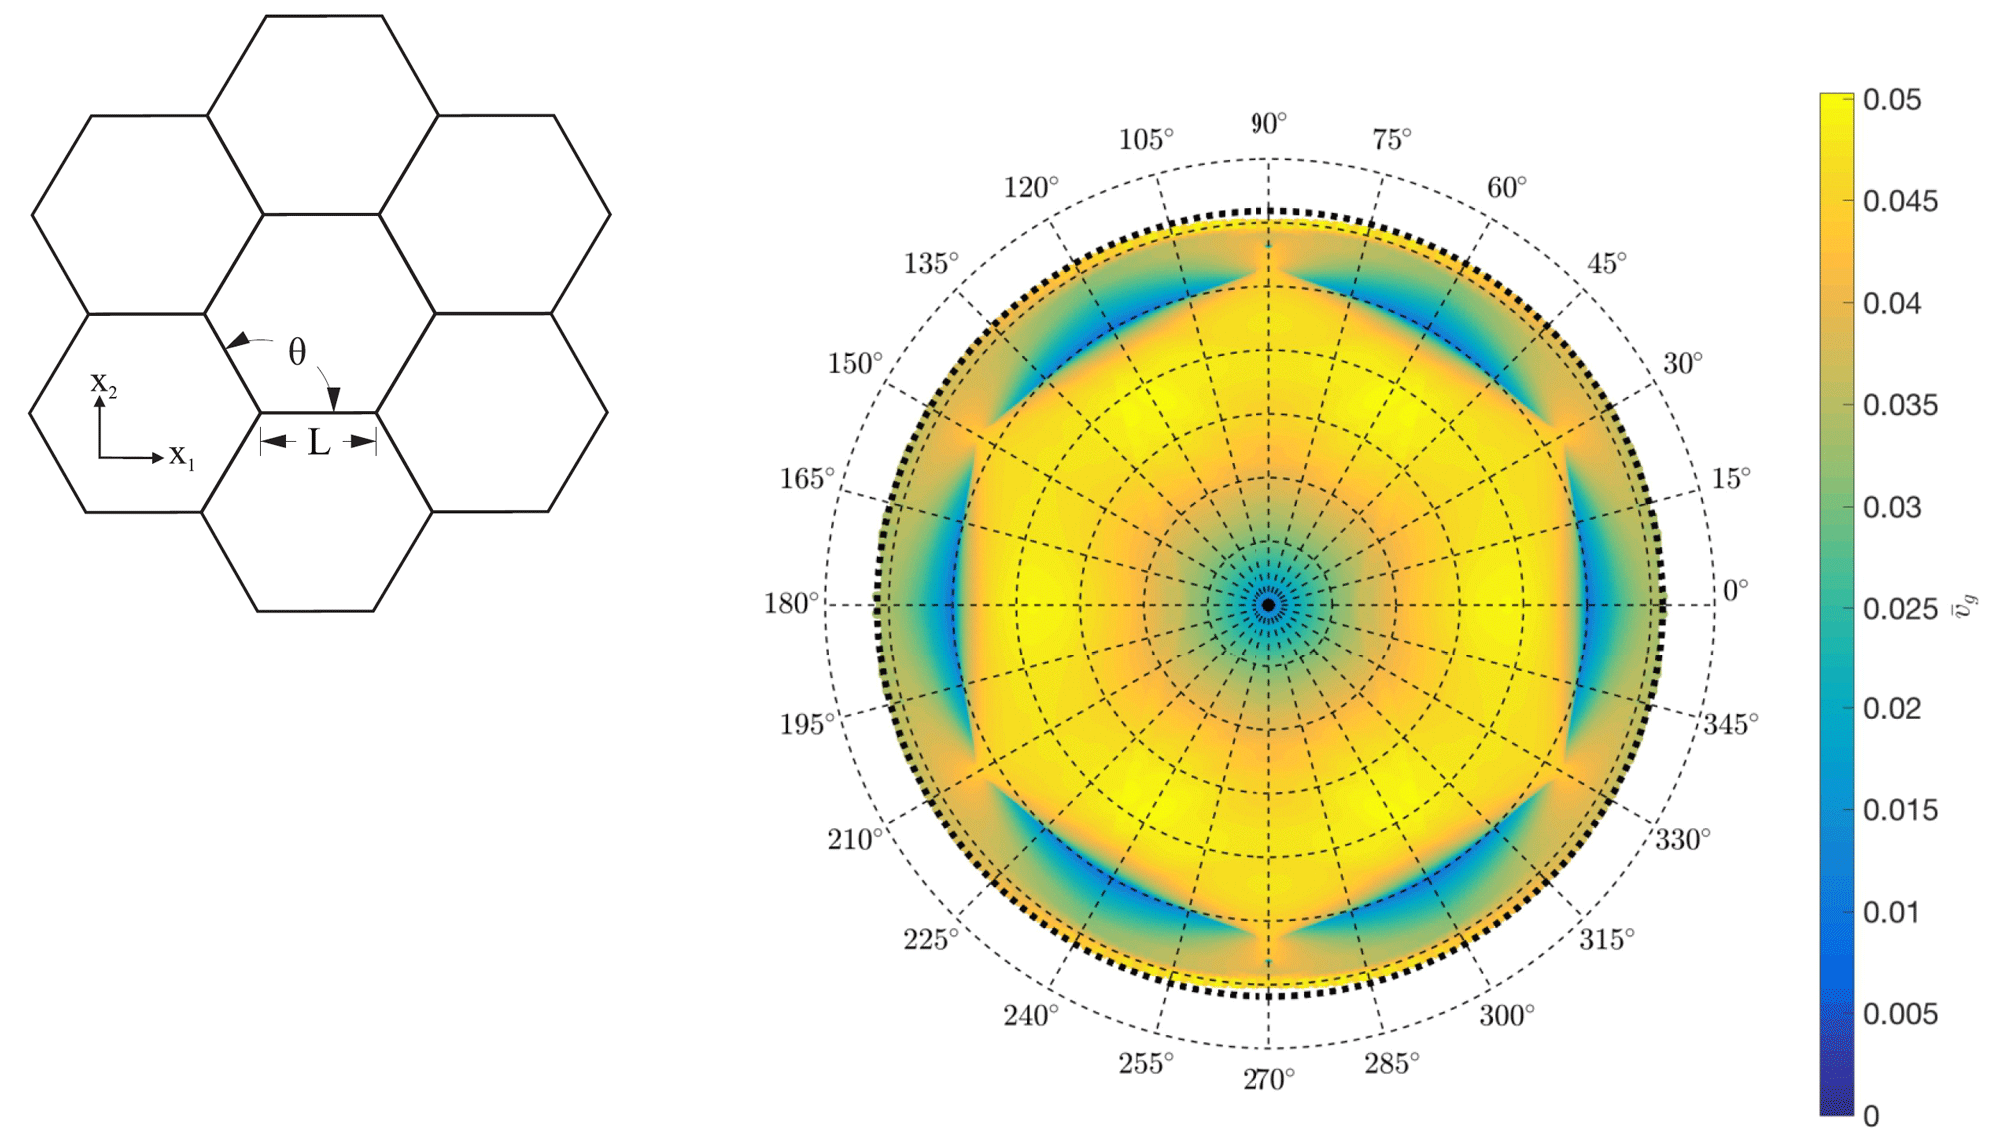
We introduced a new type of visualization (see the figure below) which illustrates the directional bias in mechanical wave propagation. Rather than presenting the dispersion relations along a dedicated path in the irriducible Brioullin zone (which is frequently done), we introduced the circular color density plot of the group velocity shown below. Each radius corresponds to an excitation frequency (the center corresponds to a zero frequency, with increasing radius the frequency increases linearly). Each frequency hence corresponds to a circle in the plot. Along this circle we plot the group velocity magnitude as a color map. Bright yellow regions corresponds to high speeds (waves will easily spread in these directions), whereas dark blue regions correspond to low group velocities (waves will spread very slowly). A key advantage of this visualization over the common dispersion relation plots is that, even in the absence of band gaps (as in the example below), we can clearly identify frequencies at which wave guiding occurs due to strong differences in directional group velocity. Consider e.g. the frequency at which we observe the six-fold symmetric blue regions: at this particular frequency, waves are expected to propagate primarily along the yellow directions but not along the blue directions - even though there is no band gap.
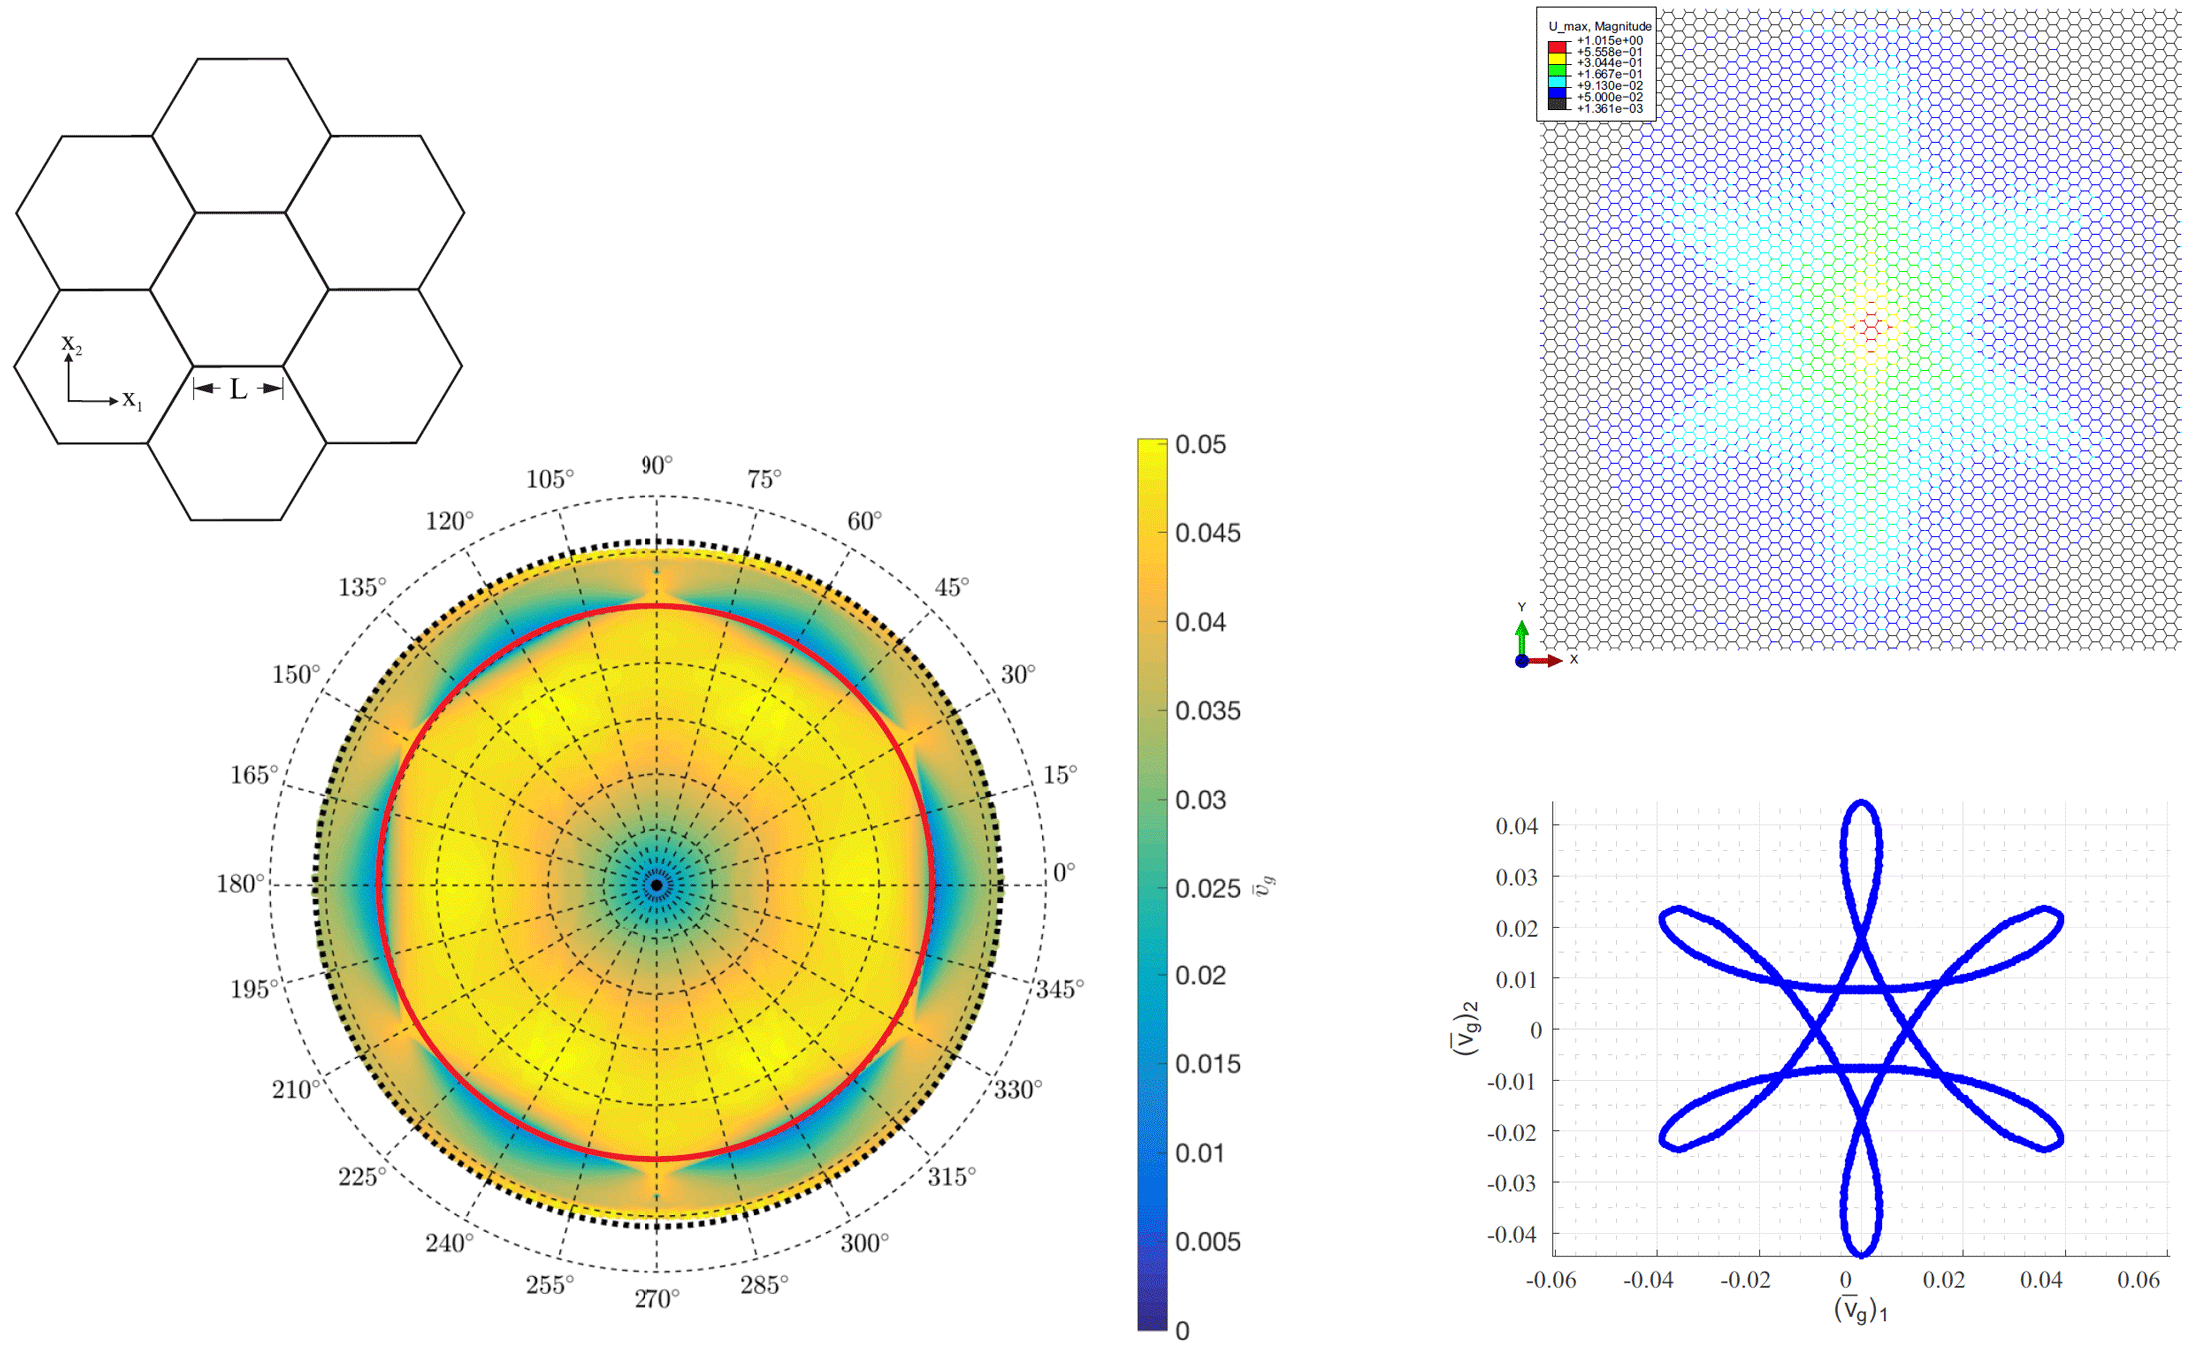
For example, at the frequency highlighted by the red circle in the figure below, the group velocity varies dramatically between blue and yellow regions. If the structure is excited at this frequency, waves will spread primarily in the yellow directions but hardly in the blue ones. This was verified by direct numerical calculations, as shown on the right in the figure below. The color code indicates the displacement amplitude for each node of the 2D lattice. We clearly observe that waves propagate primarily in those six directions corresponding to the yellow areas in the group velocity color density plot (the figure below confirms this by computing the group velocity). Such directional behavior would not be recognized by means of band gaps only.
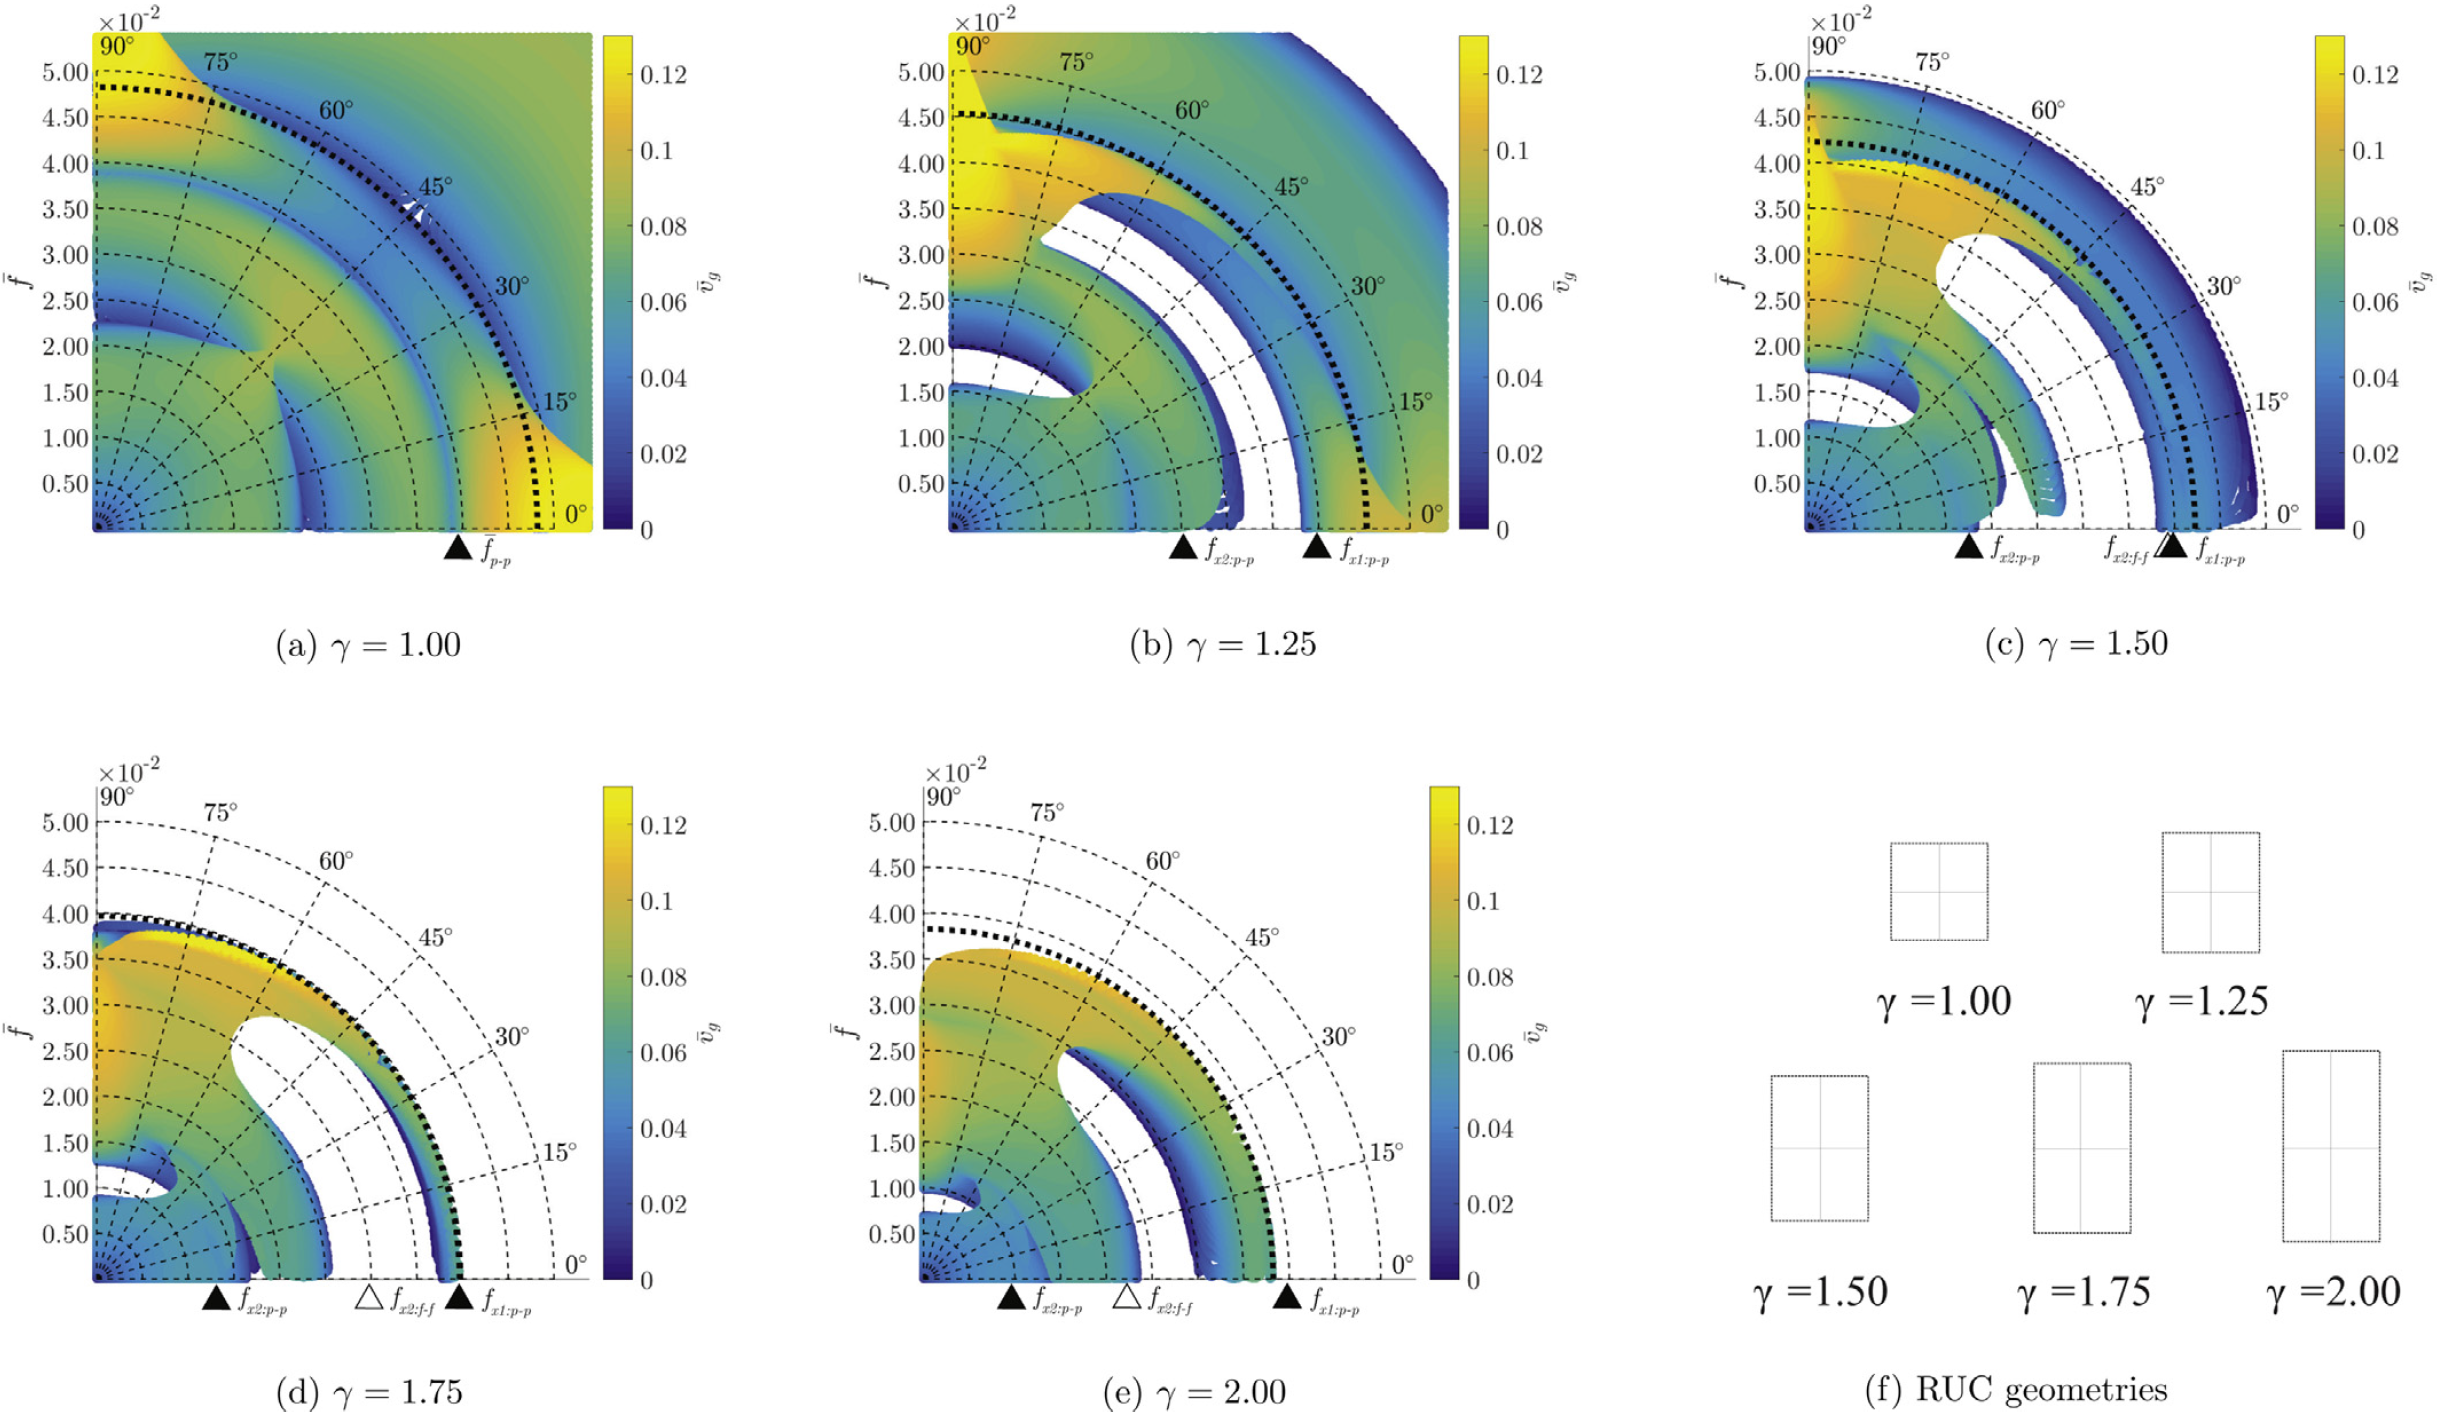
Band gaps apear as white regions in these circular plots (no group velocity exists at all for those combinations of frequency and direction). Shown below is the example of a rectangular lattice, in which we vary the aspect ratio of the two strut lengths - starting from a square and increasing the aspect ratio. For reasons of symmetry, we only plot the first quadrant of the circular group velocity density plots for five different aspect ratios. While the square (1.00) shows no band gap but directional dependecy of the group velocity, all rectangular architectures (>1) demonstrate stop bands as white regions. At those frequencies and in those directions we do not expect any energy to flow. We note that these are partial band gaps. Complete band gaps would appear as white circles (waves do not propagate in all directions).
We exploit this method of investigation to understand and optimize the wave guiding capability of metamaterials and, in particular, truss networks. Besides periodic truss arrangements (as those shown above), we also investigate functionally graded structures in which the unit cell architecture changes gradually throughout the truss. This bears potential for engineering the wave propagation across the full frequency spectrum and admits careful control such as wave steering and signal processing.


